
Detection of Aspartylglucosaminuria Patients from Magnetic Resonance Images by a Machine-Learning-Based Approach
 , , , , , and
Abstract
:1. Introduction
2. Materials and Methods
2.1. Subjects
2.2. MRI Sequence Parameters
2.3. Image Segmentation and Feature Extraction
2.4. Random Forest Classifier
3. Results
4. Discussion
5. Conclusions
Author Contributions
Funding
Institutional Review Board Statement
Informed Consent Statement
Data Availability Statement
Acknowledgments
Conflicts of Interest
Abbreviations
| AGA | Aspartylglucosaminidase |
| AGU | Aspartylglucosaminuria |
| AUC | Area under the curve |
| MRI | Magnetic resonance imaging |
| ROC | Receiver operating characteristic |
| SWI | Susceptibility-weighted image |
References
- Arvio, M.; Mononen, I. Aspartylglycosaminuria: A review. Orphanet J. Rare Dis. 2016, 11, 162. [Google Scholar] [CrossRef] [Green Version]
- Goodspeed, K.; Feng, C.; Laine, M.; Lund, T. Aspartylglucosaminuria: Clinical Presentation and Potential Therapies. J. Child Neurol. 2021, 36, 403–414. [Google Scholar] [CrossRef] [PubMed]
- Chen, Y.C.; Ma, N.X.; Pei, Z.F.; Wu, Z.; Do Monte, F.; Keefe, S.; Yellin, E.; Chen, M.; Yin, J.; Lee, G.; et al. A NeuroD1 AAV-Based Gene Therapy for Functional Brain Repair after Ischemic Injury through In Vivo Astrocyte-to-Neuron Conversion. Mol. Ther. 2019, 28, 217–234. [Google Scholar] [CrossRef] [Green Version]
- Banning, A.; Gülec, C.; Rouvinen, J.; Gray, S.J.; Tikkanen, R. Identification of Small Molecule Compounds for Pharmacological Chaperone Therapy of Aspartylglucosaminuria. Sci. Rep. 2016, 6, 37583. [Google Scholar] [CrossRef] [Green Version]
- Tokola, A.; Laine, M.; Tikkanen, R.; Autti, T. Susceptibility-Weighted Imaging Findings in Aspartylglucosaminuria. Am. J. Neuroradiol. 2019, 40, 1850–1854. [Google Scholar] [CrossRef]
- Sairanen, V.; Tokola, A.; Tikkanen, R.; Laine, M.; Autti, T. Statistical Permutation Test Reveals Progressive and Region—Specific Iron Accumulation in the Thalami of Children with Aspartylglucosaminuria. Brain Sci. 2020, 10, 677. [Google Scholar] [CrossRef]
- Autti, T.; Lönnqvist, T.; Joensuu, R. Bilateral pulvinar signal intensity decrease on t2-weighted images in patients with aspartylglucosaminuria. Acta Radiol. 2008, 49, 687–692. [Google Scholar] [CrossRef]
- Tokola, A.; Åberg, L.; Autti, T. Brain MRI findings in aspartylglucosaminuria. J. Neuroradiol. 2015, 42, 345–357. [Google Scholar] [CrossRef]
- Fagan, N.; Alexander, A.; Irani, N.; Saade, C.; Naffaa, L. Magnetic resonance imaging findings of central nervous system in lysosomal storage diseases: A pictorial review. J. Med. Imaging Radiat. Oncol. 2017, 61, 344–352. [Google Scholar] [CrossRef]
- Tokola, A.; Branstack, N.; Hakkarainen, A.; Salli, E.; Åberg, L.; Autti, T. White Matter Microstructure and Subcortical Gray Matter Structure Volumes in Aspartylglucosaminuria; a 5-Year Follow-up Brain MRI Study of an Adolescent with Aspartylglucosaminuria and His Healthy Twin Brother. JIMD Rep. 2017, 35, 105–115. [Google Scholar]
- Sharma, G.; Robertson, D.; Laney, D.; Gambello, M. Machine learning based analytics of micro-MRI trabecular bone microarchitecture and texture in type 1 Gaucher disease. J. Biomech. 2016, 49, 1961–1968. [Google Scholar] [CrossRef]
- Klein, J.; Baker, N.; Zorn, K.; Daniel, P.; Russo, D.; Rubio, A.; Clark, A.; Ekins, S. Data mining and machine learning for lysosomal disease drug discovery and beyond. Mol. Genet. Metab. 2019, 126, S86. [Google Scholar] [CrossRef]
- Ranjbar, S.; Velgos, S.N.; Dueck, A.C.; Geda, Y.E.; Mitchell, J.R. Brain MR Radiomics to Differentiate Cognitive Disorders. J. Neuropsychiatry Clin. Neurosci. 2019, 31, 210–219. [Google Scholar] [CrossRef]
- Cheung, E.; Chau, A.; Tang, F.H. Radiomics-Based Artificial Intelligence Differentiation of Neurodegenerative Diseases with Reference to the Volumetry. Life 2022, 12, 514. [Google Scholar] [CrossRef]
- Desikan, R.S.; Ségonne, F.; Fischl, B.; Quinn, B.T.; Dickerson, B.C.; Blacker, D.; Buckner, R.L.; Dale, A.M.; Maguire, R.P.; Hyman, B.T.; et al. An automated labeling system for subdividing the human cerebral cortex on MRI scans into gyral based regions of interest. NeuroImage 2006, 31, 968–980. [Google Scholar] [CrossRef]
- Fischl, B.; van der Kouwe, A.; Destrieux, C.; Halgren, E.; Ségonne, F.; Salat, D.H.; Busa, E.; Seidman, L.J.; Goldstein, J.; Kennedy, D.; et al. Automatically Parcellating the Human Cerebral Cortex. Cereb. Cortex 2004, 14, 11–22. [Google Scholar] [CrossRef] [Green Version]
- Fischl, B.; Salat, D.H.; van der Kouwe, A.J.; Makris, N.; Ségonne, F.; Quinn, B.T.; Dale, A.M. Sequence-independent segmentation of magnetic resonance images. NeuroImage 2004, 23, S69–S84. [Google Scholar] [CrossRef] [Green Version]
- Segonne, F.; Pacheco, J.; Fischl, B. Geometrically accurate topology-correction of cortical surfaces using nonseparating loops. IEEE Trans. Med. Imaging 2007, 26, 518–529. [Google Scholar] [CrossRef]
- Reuter, M.; Fischl, B. Avoiding Asymmetry-Induced Bias in Longitudinal Image Processing. NeuroImage 2011, 57, 19–21. [Google Scholar] [CrossRef] [Green Version]
- Reuter, M.; Schmansky, N.J.; Rosas, H.D.; Fischl, B. Within-Subject Template Estimation for Unbiased Longitudinal Image Analysis. NeuroImage 2012, 61, 1402–1418. [Google Scholar] [CrossRef] [Green Version]
- Reuter, M.; Rosas, H.D.; Fischl, B. Highly Accurate Inverse Consistent Registration: A Robust Approach. NeuroImage 2010, 53, 1181–1196. [Google Scholar] [CrossRef]
- Iglesias, J.E.; Insausti, R.; Lerma-Usabiaga, G.; Bocchetta, M.; Leemput, K.V.; Greve, D.N.; van der Kouwe, A.; Fischl, B.; Caballero-Gaudes, C.; Paz-Alonso, P.M. A probabilistic atlas of the human thalamic nuclei combining ex vivo MRI and histology. arXiv 2018, arXiv:1806.08634. [Google Scholar] [CrossRef]
- Fedorov, A.; Beichel, R.; Kalpathy-Cramer, J.; Finet, J.; Fillion-Robin, J.; Pujol, S.; Bauer, C.; Jennings, D.; Fennessy, F.; Sonka, M.; et al. 3D Slicer as an Image Computing Platform or the Quantitative Imaging Network. Magnetic Resonance Imaging. J. Biomech. 2012, 30, 1323–1341. [Google Scholar]
- van Griethuysen, J.; Fedorov, A.; Parmar, C.; Hosny, A.; Aucoin, N.; Narayan, V.; Beets-Tan, R.; Fillion-Robin, J.C.; Pieper, S.; Aerts, H. Computational Radiomics System to Decode the Radiographic Phenotype. Cancer Res. 2017, 77, e104–e107. [Google Scholar] [CrossRef] [Green Version]
- Thibault, G.; Fertil, B.; Navarro, C.; Pereira, S.; Lévy, N.; Sequeira, J.; Mari, J.L. Texture Indexes and Gray Level Size Zone Matrix Application to Cell Nuclei Classification. In Proceedings of the 10th International Conference on Pattern Recognition and Information Processing, Minsk, Belarus, 19–21 May 2009. [Google Scholar]
- Radiomic Features. Available online: https://pyradiomics.readthedocs.io/en/latest/features.html#radiomic-features (accessed on 1 September 2022).
- Sammut, C.; Webb, G. (Eds.) Leave-One-Out Cross-Validation. In Encyclopedia of Machine Learning; Springer: Boston, MA, USA, 2010; pp. 600–601. [Google Scholar] [CrossRef]


| MR Image Type | Patient Number | Control Number | Mean Age Patient (years) | Mean Age Control (years) |
|---|---|---|---|---|
| T1 | 12 male | 16 male | 11.0 ± 3.4 | 10.7 ± 2.4 |
| 10 female | 8 female | 10.1 ± 2.9 | 11.0 ± 2.1 | |
| 22 total | 24 total | 10.6 ± 3.1 | 11.2 ± 3.0 | |
| T2 | 12 | 5 | 11.0 ± 3.4 | 11.8 ± 2.0 |
| 7 19 | 9 14 | 10.0 ± 3.3 12.8 ± 3.3 | 13.7 ± 2.9 13.0 ± 2.7 | |
| SWI | 10 | 7 | 11.0 ± 3.4 | 8.7 ± 1.5 |
| 6 | 9 | 10.1 ± 3.4 | 12.1 ± 2.8 | |
| 16 | 16 | 10.7 ± 3.3 | 10.8 ± 3.0 |
| Model | MR Image Type | Features | Patients | Controls | Total Subjects |
|---|---|---|---|---|---|
| 1 | T1 | Nucleic Volumes | 22 | 24 | 46 |
| 2 | T1 | Whole Volume | 22 | 24 | 46 |
| 3 | T1 | aseg Volume | 22 | 24 | 46 |
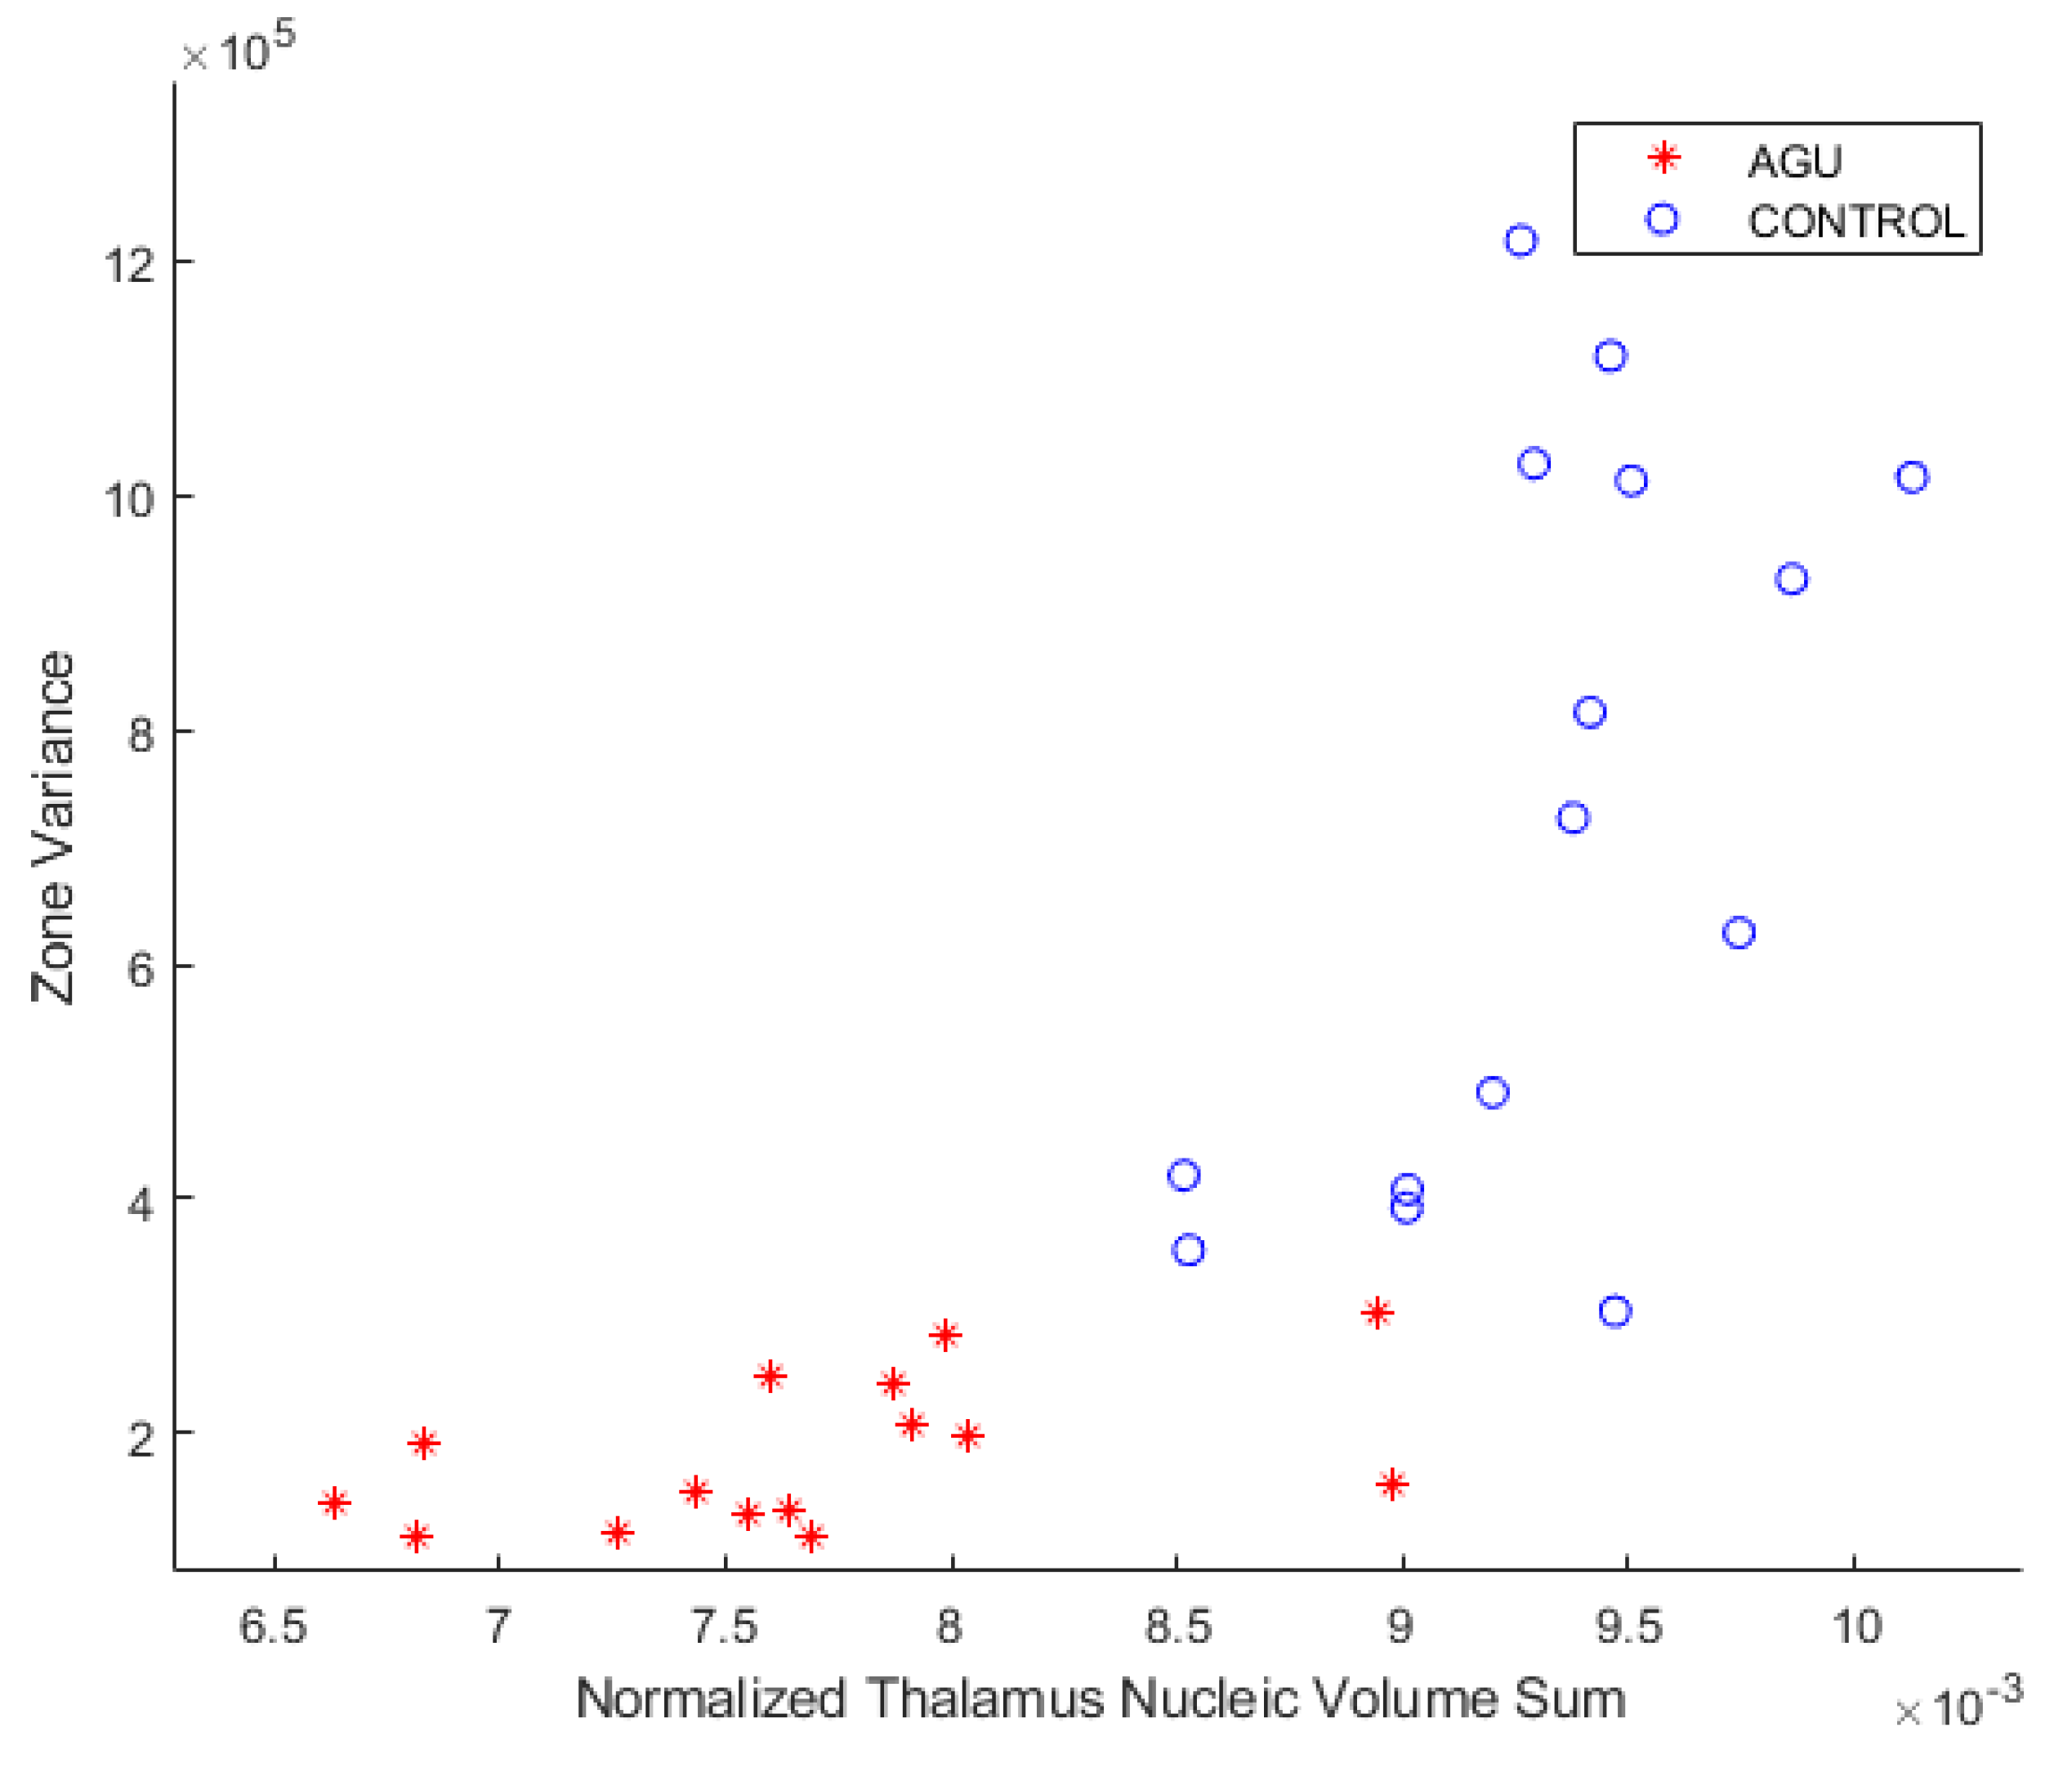
| 4 | SWI | Zone Variance | 16 | 16 | 32 |
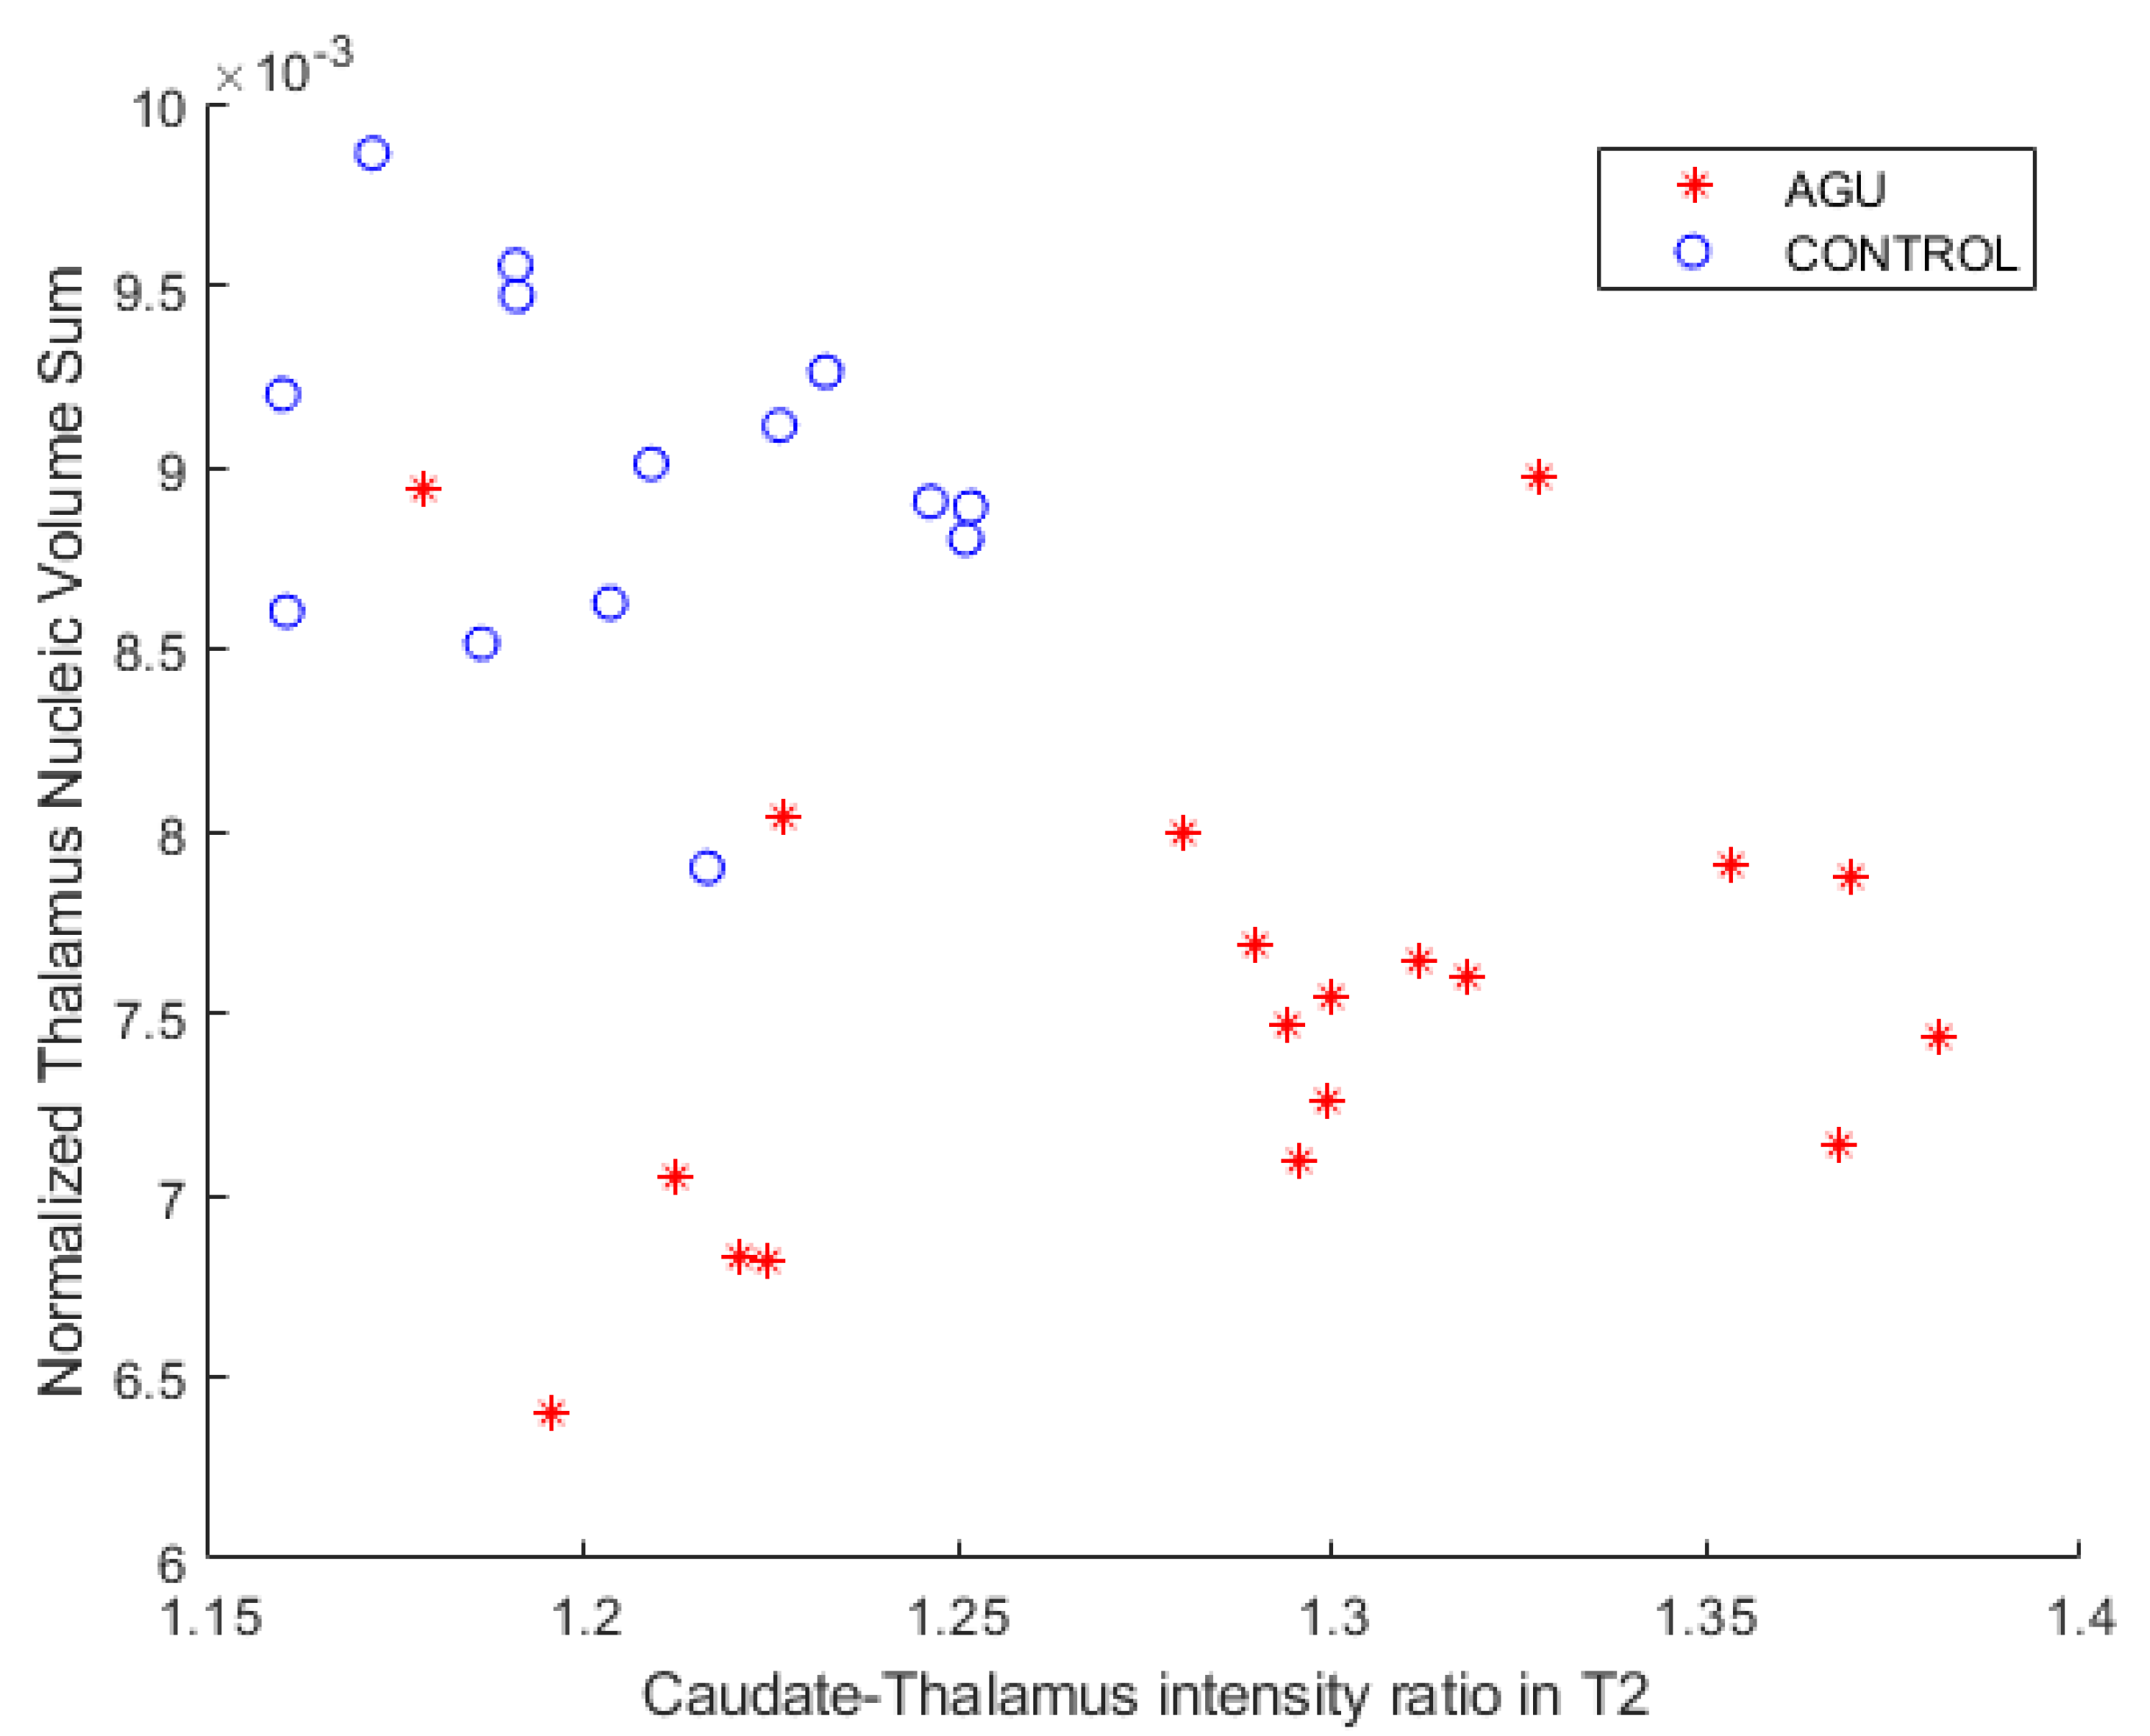
| 5 | T2 | Caudate-Thalamus Ratio | 19 | 14 | 33 |
| Title 1 | Title 3 |
|---|---|
| NumTreees | 4000 |
| OOBPrediction | on |
| Method | classification |
| Options | statset(‘UseParallel’,true) |
| cost | [0 1; 5 0] |
| Model | MR Image Type | Features | AUC | Accuracy | Sensitivity | Specificity |
|---|---|---|---|---|---|---|
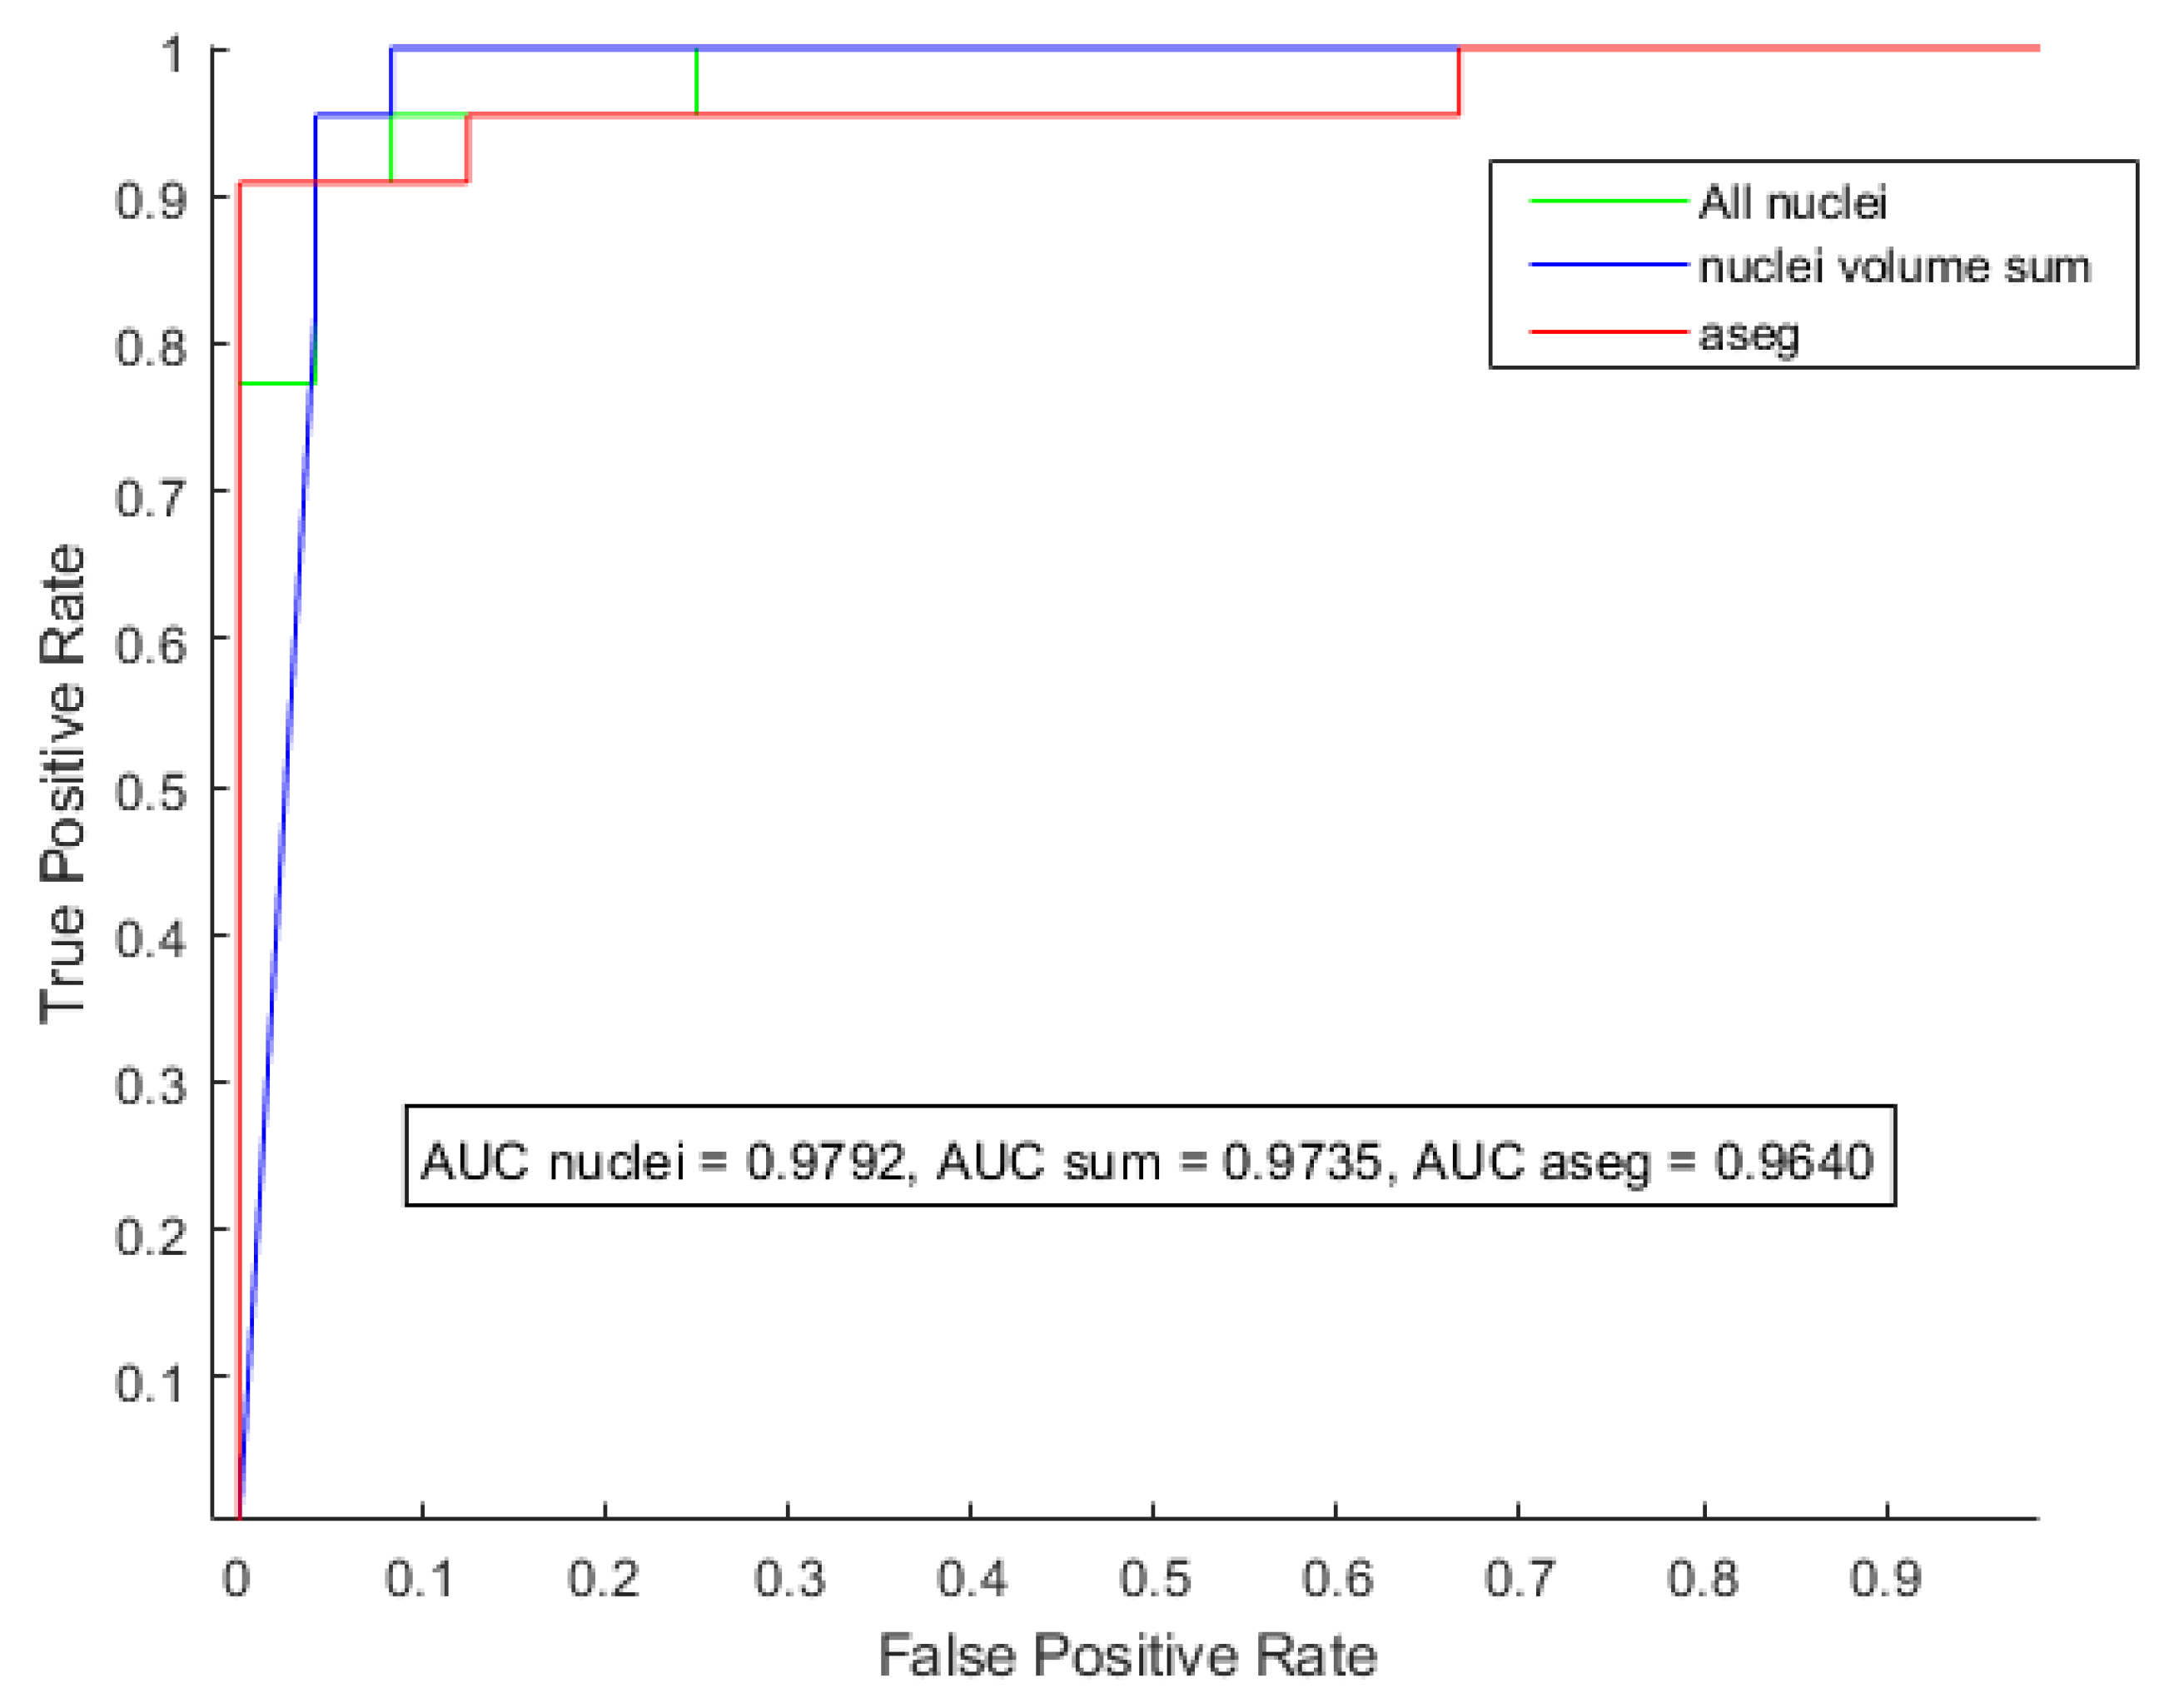
| 1 | T1 | Nucleic Volumes | 0.9792 | 0.9348 | 0.9545 | 0.9167 |
| 2 | T1 | Whole Volume | 0.9735 | 0.9348 | 0.9545 | 0.9167 |
| 3 | T1 | aseg Volume | 0.9622 | 0.9333 | 0.9130 | 0.8750 |
| 4 | SWI | Zone Variance | 0.9922 | 0.9688 | 1.0000 | 0.9375 |
| 5 | T2 | Caudate–Thalamus Ratio | 0.8008 | 0.6667 | 0.8947 | 0.3571 |
Publisher’s Note: MDPI stays neutral with regard to jurisdictional claims in published maps and institutional affiliations. |
© 2022 by the authors. Licensee MDPI, Basel, Switzerland. This article is an open access article distributed under the terms and conditions of the Creative Commons Attribution (CC BY) license (https://creativecommons.org/licenses/by/4.0/).
Share and Cite
Ruohola, A.; Salli, E.; Roine, T.; Tokola, A.; Laine, M.; Tikkanen, R.; Savolainen, S.; Autti, T. Detection of Aspartylglucosaminuria Patients from Magnetic Resonance Images by a Machine-Learning-Based Approach. Brain Sci. 2022, 12, 1522. https://doi.org/10.3390/brainsci12111522
Ruohola A, Salli E, Roine T, Tokola A, Laine M, Tikkanen R, Savolainen S, Autti T. Detection of Aspartylglucosaminuria Patients from Magnetic Resonance Images by a Machine-Learning-Based Approach. Brain Sciences. 2022; 12(11):1522. https://doi.org/10.3390/brainsci12111522
Chicago/Turabian StyleRuohola, Arttu, Eero Salli, Timo Roine, Anna Tokola, Minna Laine, Ritva Tikkanen, Sauli Savolainen, and Taina Autti. 2022. "Detection of Aspartylglucosaminuria Patients from Magnetic Resonance Images by a Machine-Learning-Based Approach" Brain Sciences 12, no. 11: 1522. https://doi.org/10.3390/brainsci12111522